 AI Coding Usage Meter
Stream Deck plugin · Windows & macOS
Your AI coding usage.
On a key.
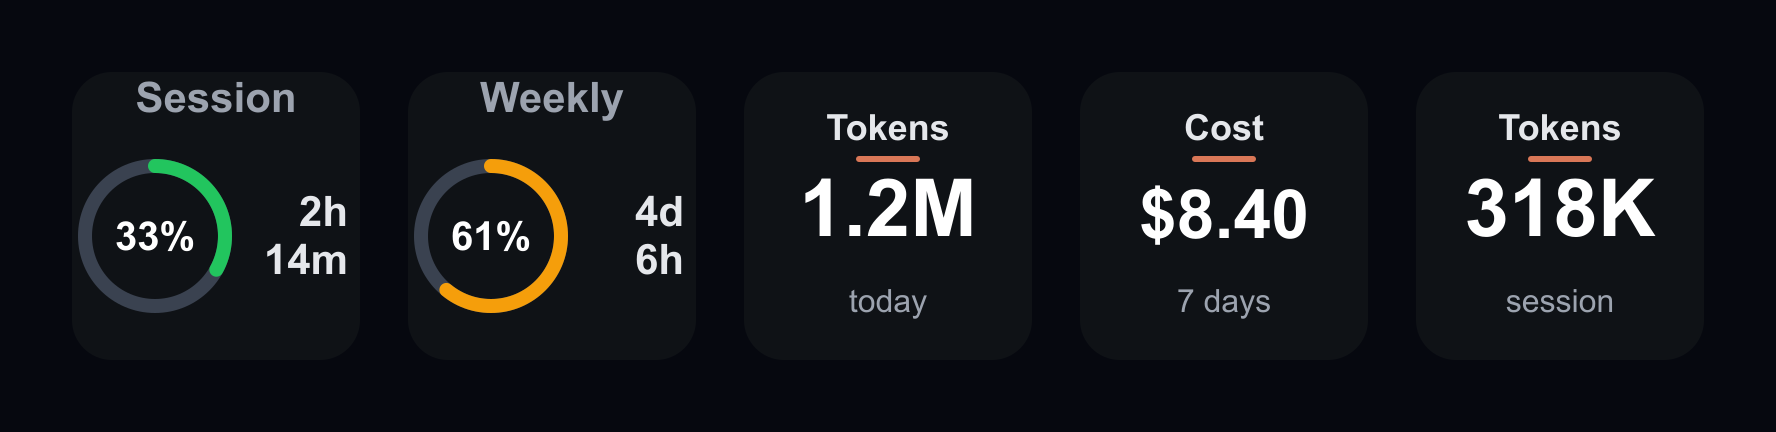
Live session and weekly limits, tokens, and cost, rendered straight onto your Stream Deck. One action, as many keys as you like. Tap to refresh.
Free · open source · MIT licensed
Limits
The whole budget, at a glance.
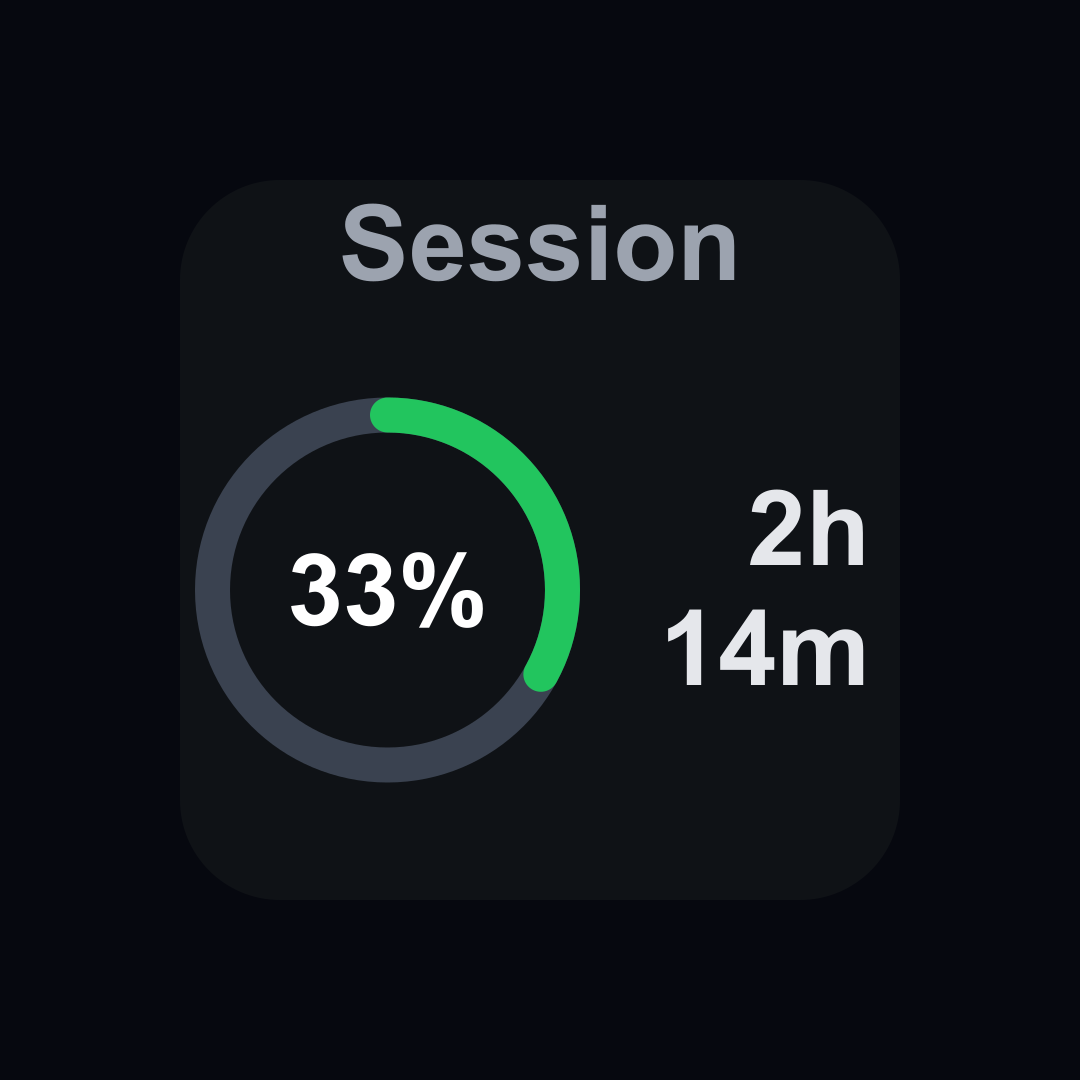
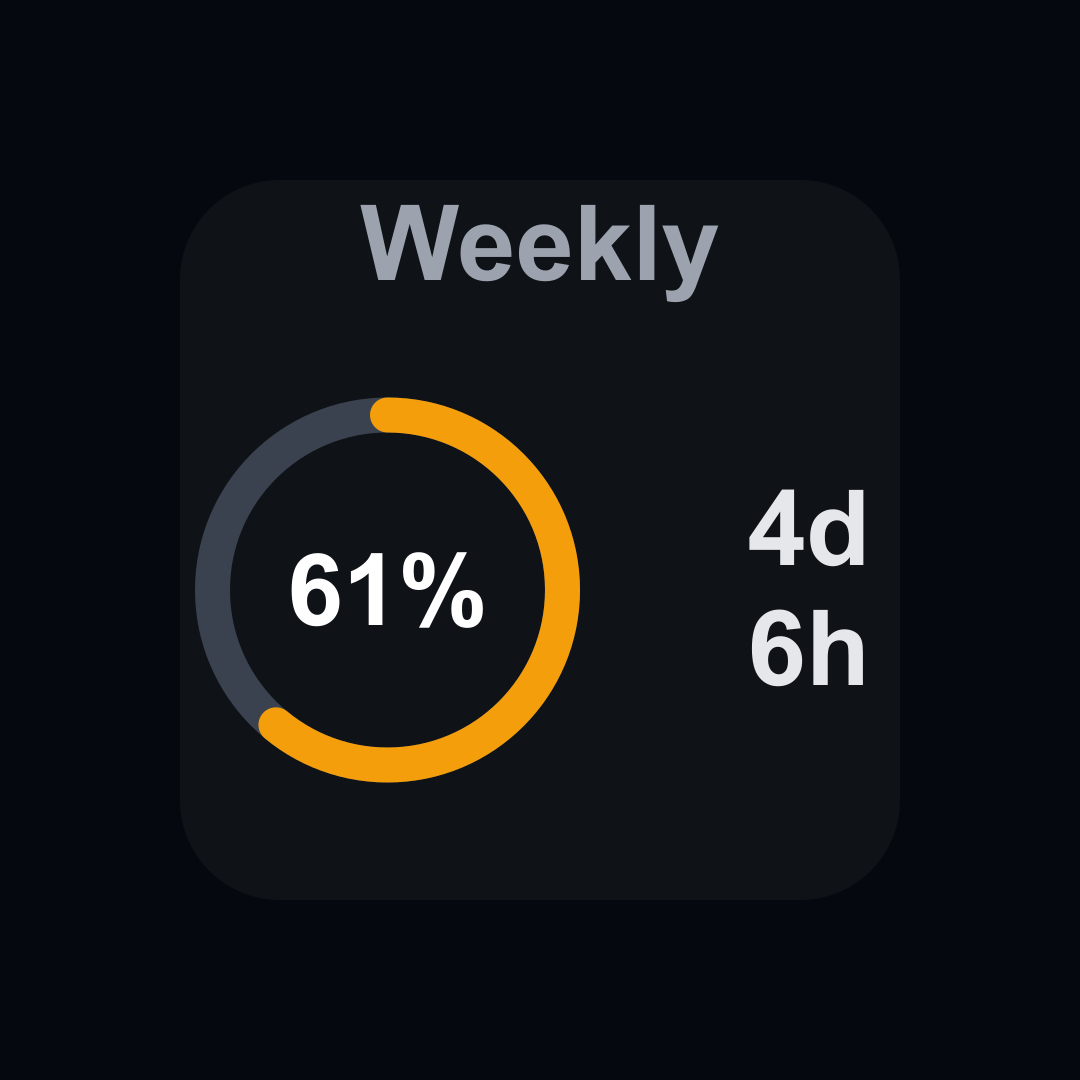
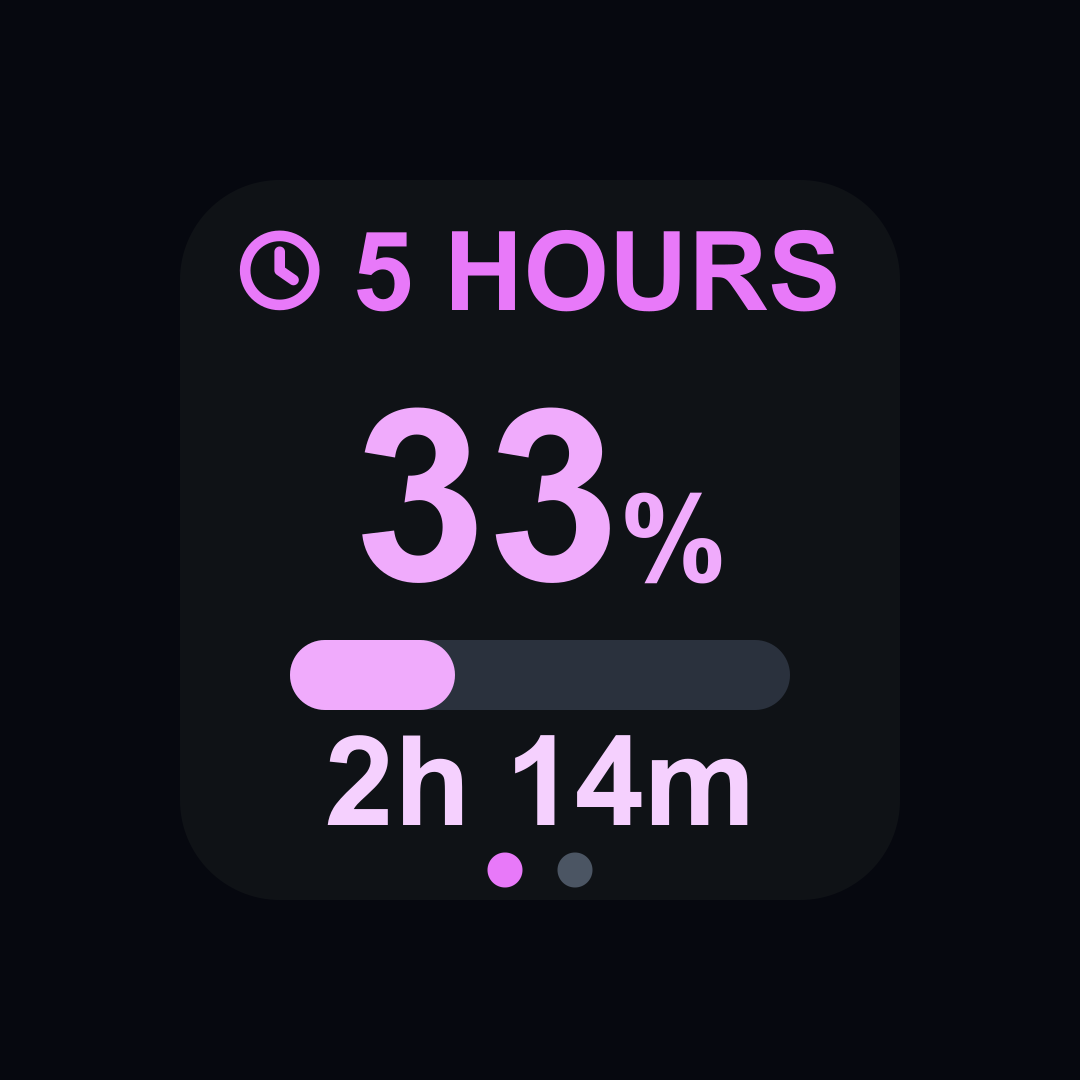
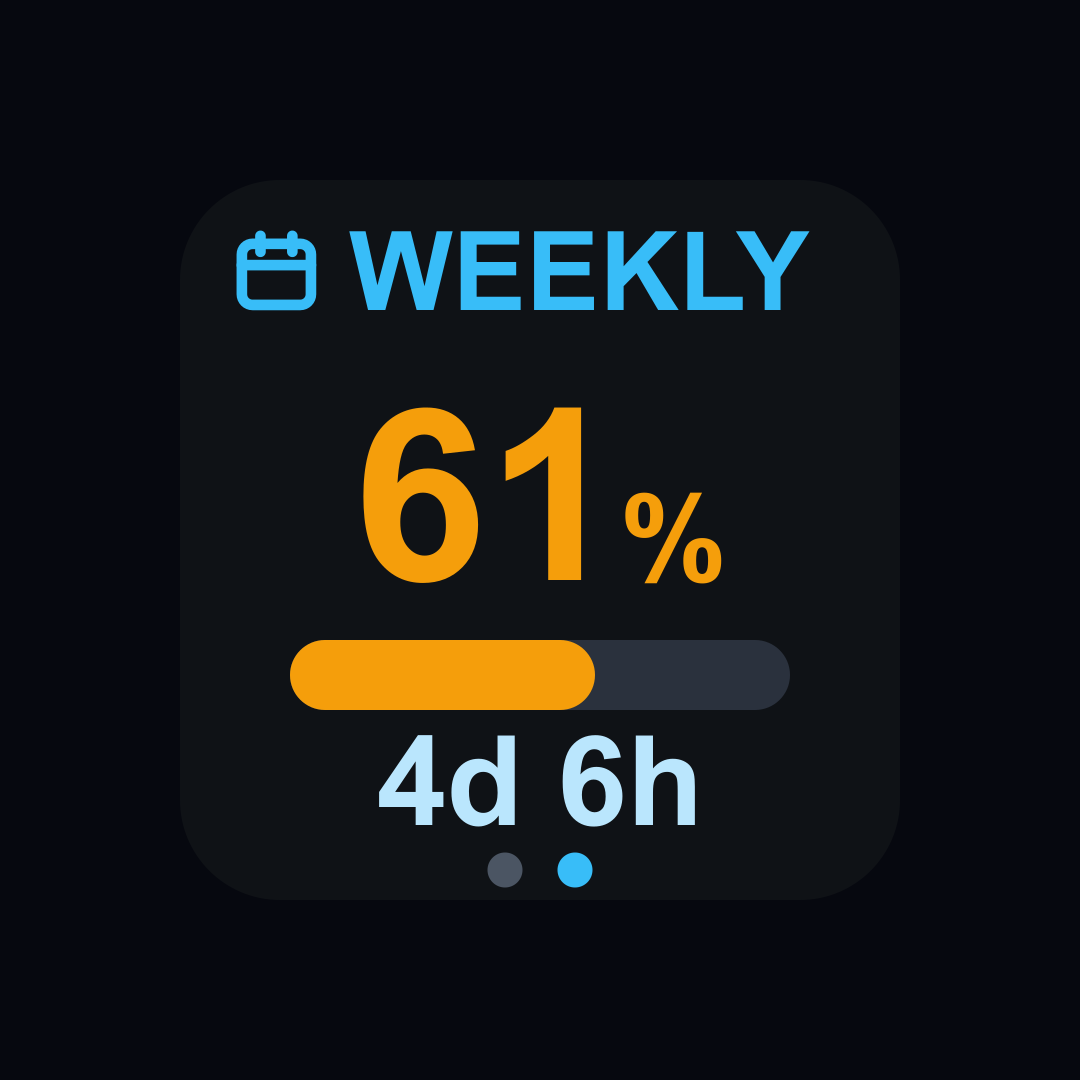
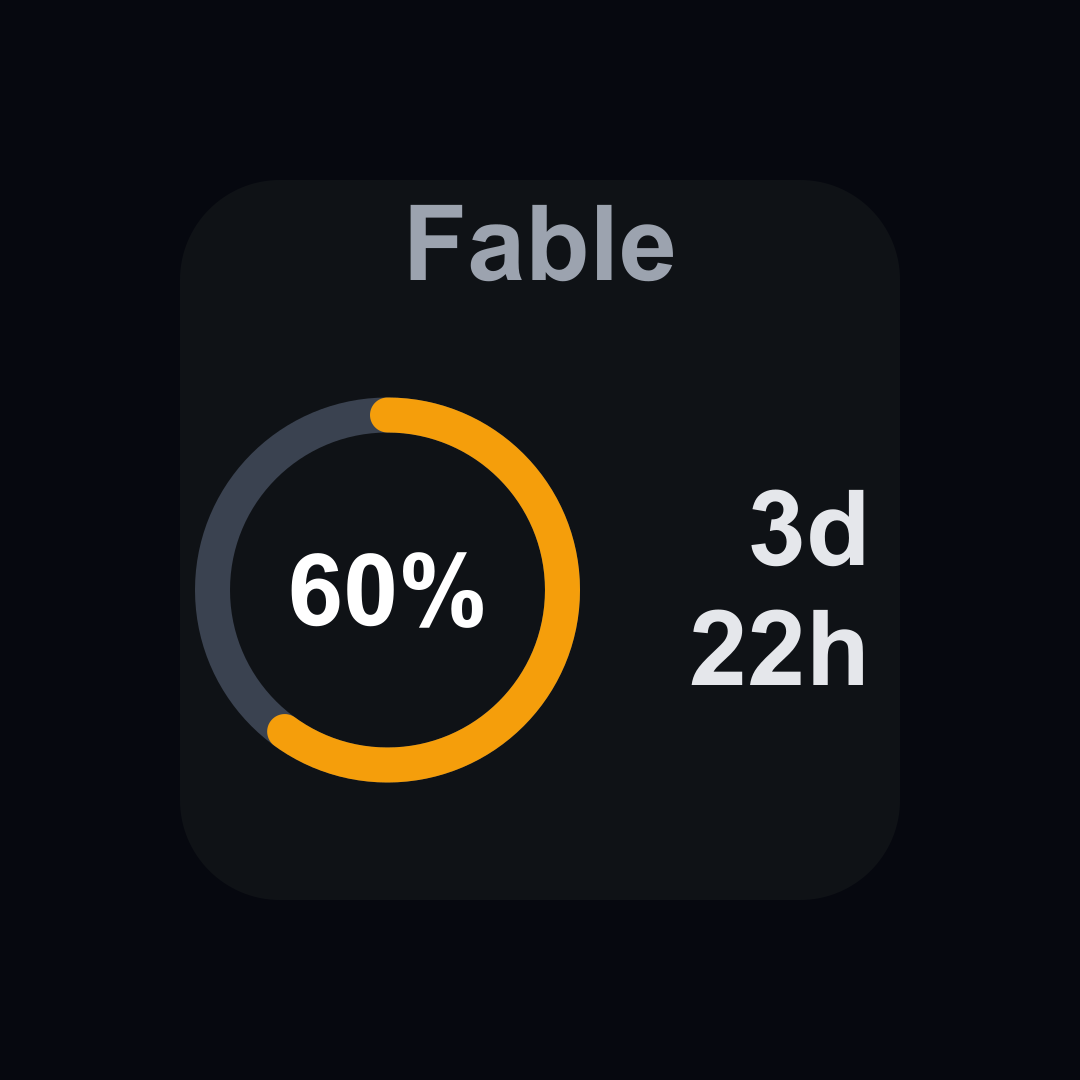
Session (5h) and weekly (7d) utilization as color-coded ring gauges (green, amber, red), each with a live reset countdown. Pro and Max plans both supported. Short on keys? One carousel key alternates between both windows on your own interval, or flips when you press it.
Profiles
Work and personal, side by side.
Run more than one Claude account? Set the profile per key. One key watches work, the next watches personal, both live at once — no switching, no guessing which one you are looking at.
Found for you
Every config folder beside ~/.claude shows up in the
dropdown, labelled with its account email and plan. Point at one
elsewhere by typing the path.
Kept apart
Each profile gets its own cache, so a key on one account can never quietly show you another's numbers.
Nothing to configure
One account? Leave it alone. The default profile is selected automatically and nothing changes.
Tokens & cost
Counted from your own logs.
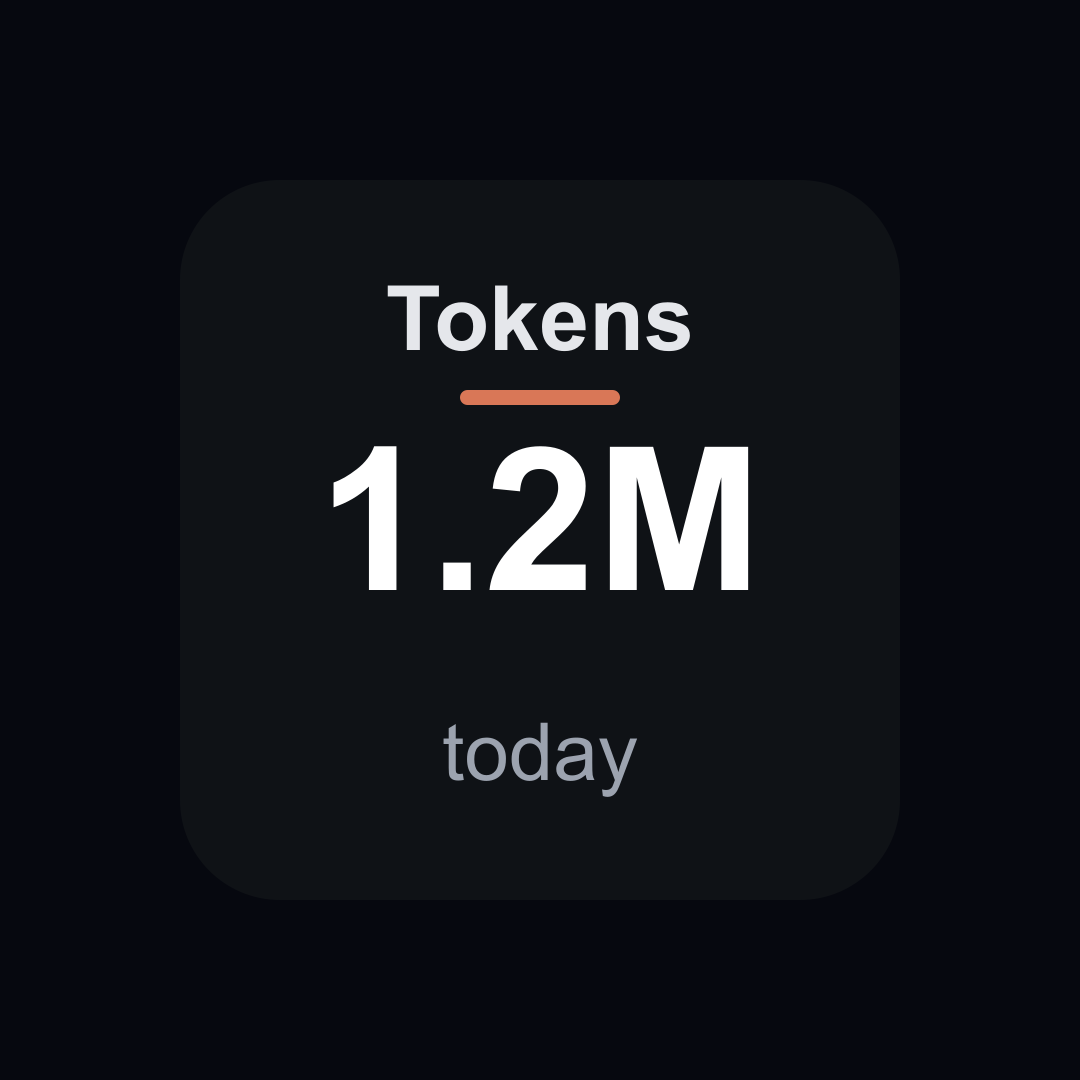
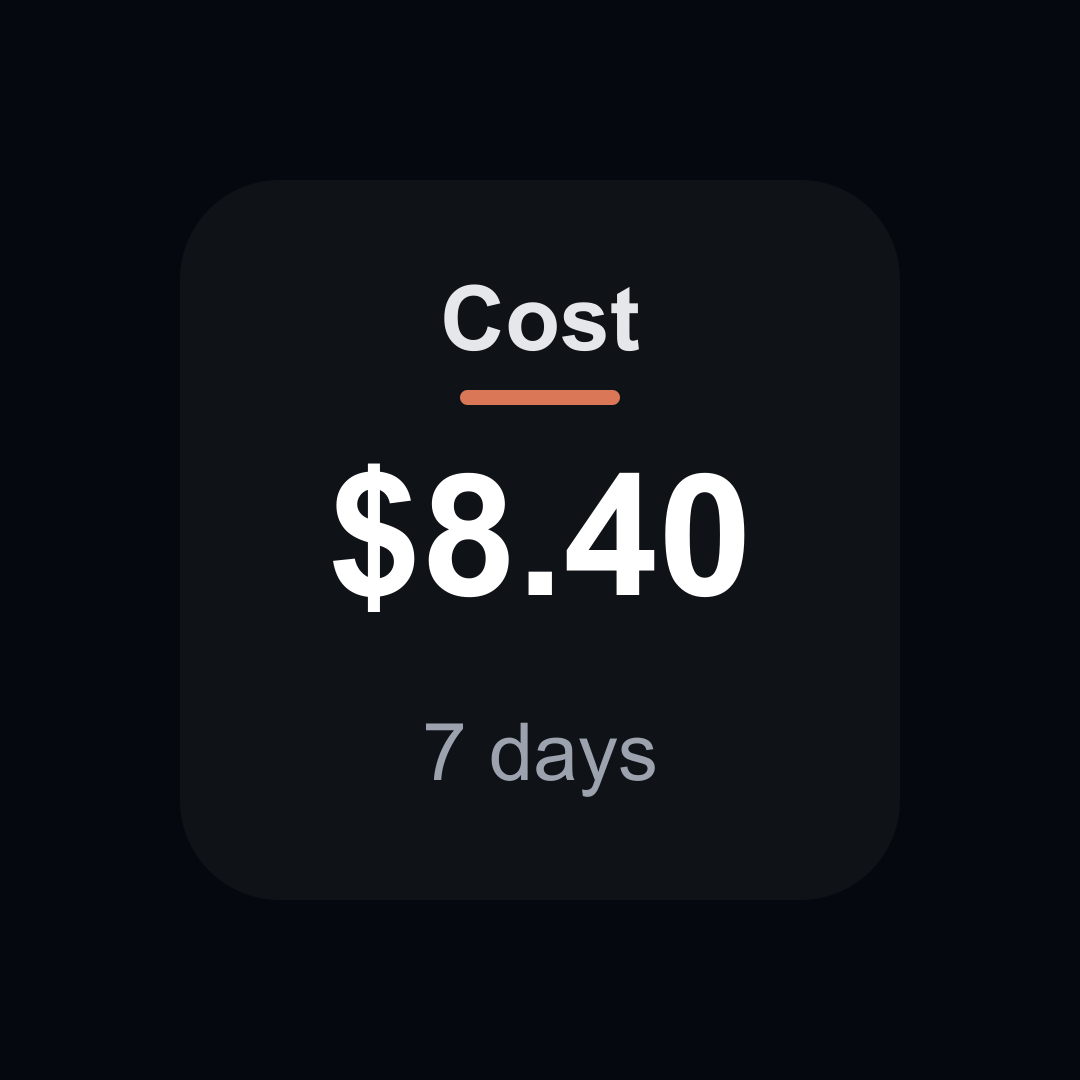
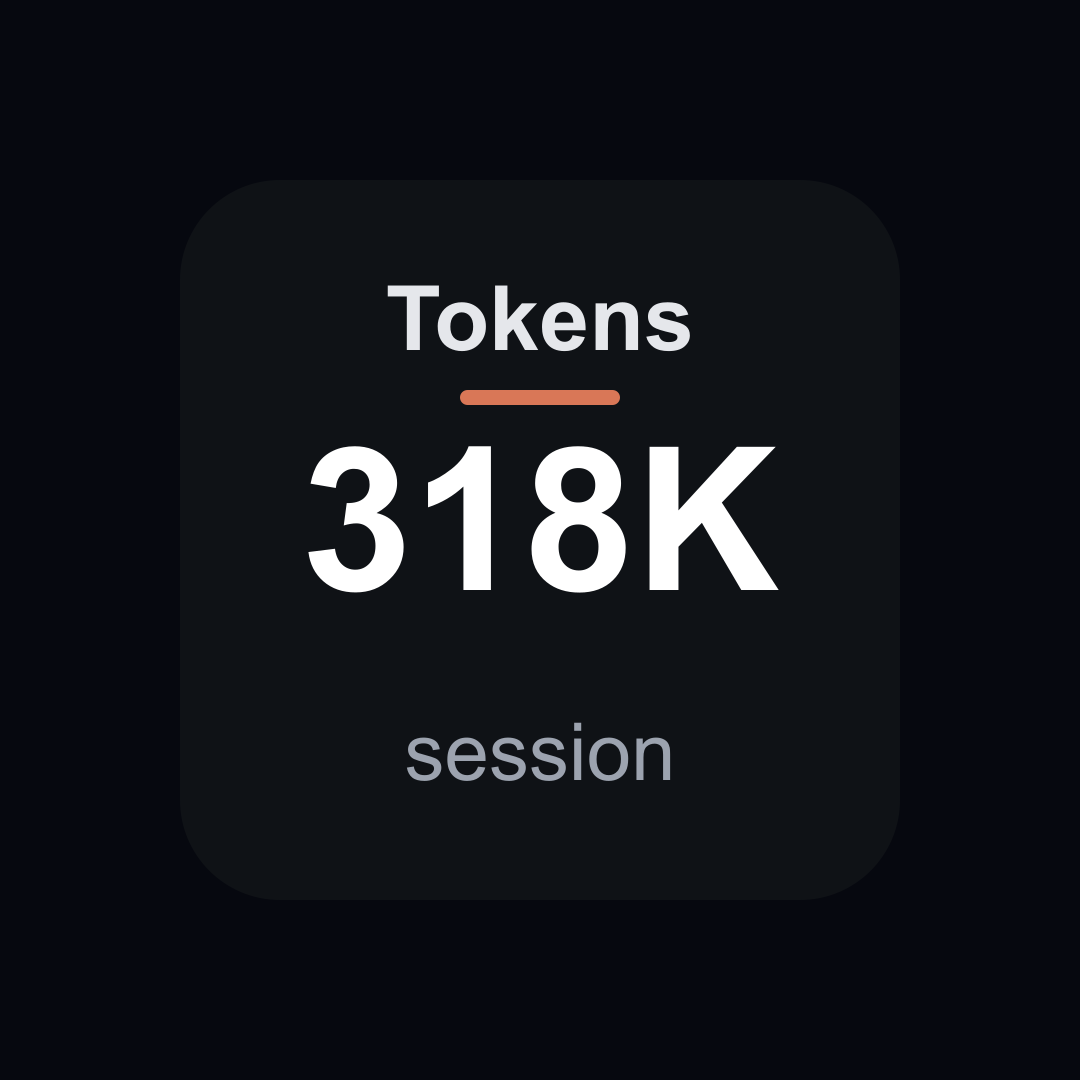
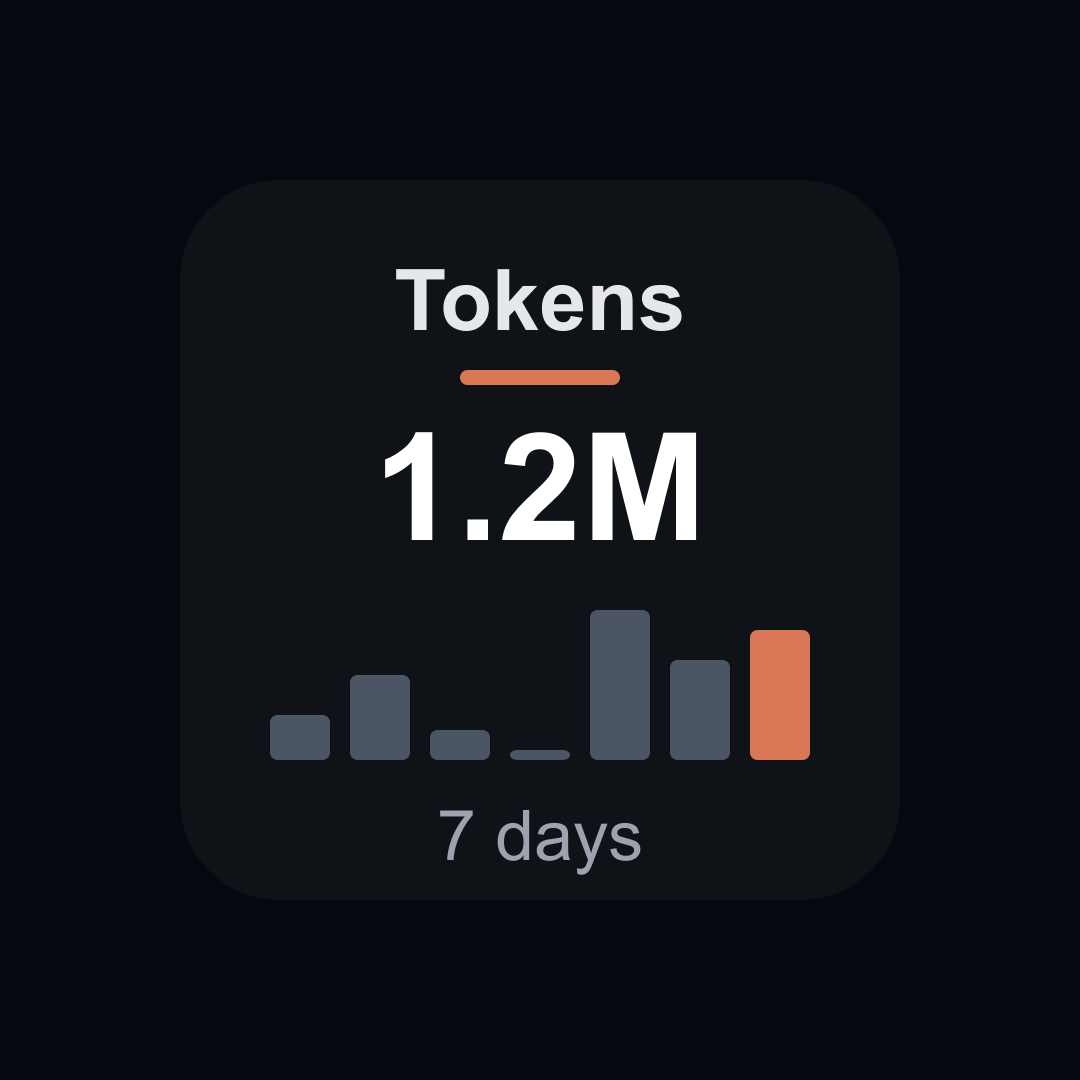
Token totals and equivalent spend, parsed locally from Claude Code's transcripts. Pick today, the last 7 days, or your current session, per key.
New
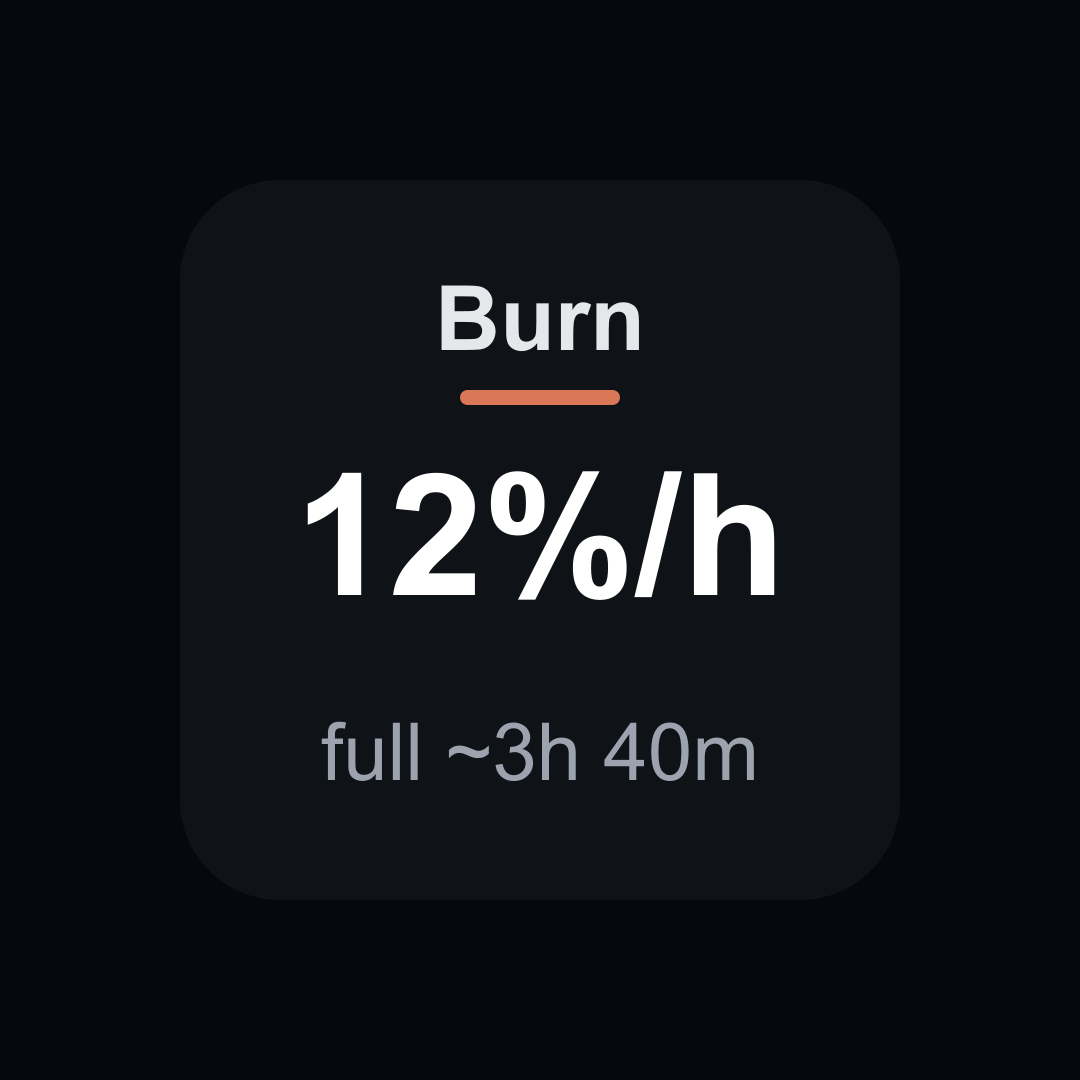
Model caps, burn rate & history.
The per-model weekly cap some plans report, your burn rate in
%/h with a time-to-full projection, and 7-day charts backed by
history that survives Claude Code pruning its logs. Plus: keys
flash once when a limit crosses Red, a Stream Deck +
dial action puts any metric on the touch strip, and every poll
writes a stats.json for overlays and scripts.
Privacy
Private by design.
Runs on your machine
No servers, no analytics, no telemetry. The plugin reads data that already exists locally and draws it on your keys.
One request, to Anthropic
Your own token is sent only to Anthropic's usage endpoint, the
same one Claude Code's /usage uses. Nothing is
routed through anyone else.
Stores nothing
The credential token is never copied or cached, and transcript contents are read, totaled, and discarded.
Read the full privacy policy.
Get started
Three steps to a live key.
Install
Add the plugin to the Stream Deck app, then drag the Usage Meter action onto any key.
Pick a metric
Choose Session, Weekly, Opus, Sonnet, Tokens, or Cost in the key's settings. Repeat on more keys for the rest.
Watch it update
Keys refresh every 60 seconds, and a tap forces an immediate refresh. All keys share one cached request.
Requires the Stream Deck app 6.9+ on Windows 10+ or macOS 12+, and that you've signed in to Claude Code once on this machine. The Node runtime ships with Stream Deck, so nothing else to install.